Laura Nielsen for Frontier Scientists –
There’s a new Titanic under construction: a grandiose ocean liner, maiden voyage set for 2016. The Australian billionaire undertaking the project intends Titanic II to be a near-perfect replica of the original RMS Titanic, the ill-fated steamship which sank in 1912 after striking an iceberg. The disaster claimed over 1,500 lives.
Recreating Titanic’s voyage sounds like an ominous undertaking. Yet, thanks to international cooperation and modern technology, the Titanic II can steam forward with a good grasp of what lies in its path. The International Ice Patrol tracks icebergs that drift south past the 48th parallel where they have the potential to disrupt shipping lanes. The patrol is a joint effort between the United States and Canada managed since 1913 by the United States Coast Guard. Using information from visual sightings and aircraft-carried radar, the International Ice Patrol supplies charts and timely warnings to keep oceangoing vessels, offshore operations and fisheries safe.
Icebergs are more than just obstacles to be avoided. These often-magnificent icy wanderers have a great deal to teach us. By accumulating iceberg knowledge, researchers hope to better understand the systems that govern our planet’s cryosphere (icy places) and better anticipate our climate future.
Most icebergs originate in Greenland and Antarctica
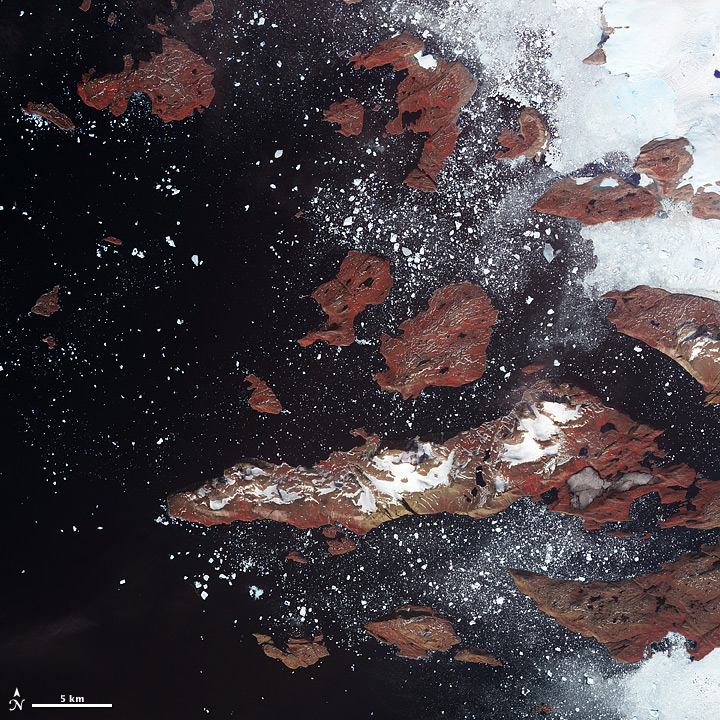
Any glacier or ice sheet can create icebergs. An iceberg is born when a portion of ice breaks away, or calves, from a major body of ice and is set adrift in the ocean. In the Northern Hemisphere most icebergs calve from glaciers along the western coast of Greenland. The ice chunks are often caught by the Labrador Current and dragged southward toward the Grand Banks off the coast of Newfoundland, Canada. It is in those waters that the RMS Titanic met its demise.
The icebergs that linger in the north, though, are no match in size for those that break off the mighty Antarctic ice sheets. Antarctica is a continent perpetually covered by ancient snow that has, over time, compacted into ice. Every year more snow is added to the icecap. All that ice is heavy, and Antarctica’s glaciers obey gravity’s pull and slowly slide closer to the sea. When the glacial ice loses contact with the shore and the sea floor near shore, it extends instead over open water. The ice forms colossal flat-topped ice sheets. Icebergs crumble from the edges of the ice sheets and drift away, often to be caught in the Antarctic Circumpolar Current.
The largest measured iceberg to date, which calved from the Ross Ice Shelf in 2000, was designated Iceberg B15. It had a surface area of 4,250 square miles [11,000 square kilometers]. Envision B15’s surface area as roughly the size of two Delawares, or approaching the size of Connecticut. That’s one big chunk of ice. Usually it takes a full year for ice sheets all across Antarctica to calve enough ice to match the volume of ice that the Larsen ice sheet lost the instant B15 broke away.
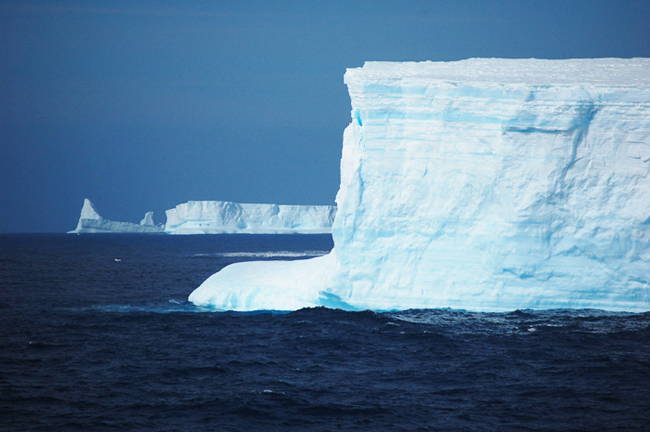
The colossal tabular (flat-topped like a table) icebergs which spawn in Antarctica are fairly easy to spot and track; they’re less dangerous than the smaller icebergs of the Arctic. Hard-to-spot Arctic ice chunks are more likely to disrupt shipping lanes. Icebergs can be classified very large, large, medium, and small- after which naming conventions get interesting. Icebergs that are less than 15 feet across are called bergy bits. Their smaller counterparts, only potentially large enough for a full-grown man to lay atop, are called growlers.
Tracking icebergs can be tricky
Because as much as seven-eighths of an iceberg might rest underwater, there is a great bulk of submerged ice for powerful ocean currents to tug at. Wind can move icebergs, but has only a small effect. Currents and winds are both secondary forces, however; tides have a much stronger say in where ocean-floating icebergs travel. The Ice Trek team with the National Snow and Ice Data Center and supported by the National Science Foundation explains: “[I]t turns out that iceberg motion is a bit like having a ball on a flat board, and then tilting the board around. The tilting represents the coming and going of the Earth’s tides, resulting in a very very gentle slope on the ocean–a slope on the order of only 1 meter height in 1,000 km. The icebergs simply slide “down-hill.”” All these conflicting forces, as well as the potential for ice to run aground on underwater stone or collide with other icebergs, can cause icebergs to follow wildly meandering paths.
While the International Ice Patrol uses sightings from ships and aircraft to track North Atlantic icebergs, Antarctica’s remote location and dangerously changeable weather call for different means. Some icebergs are tracked via buoys, which run on batteries and emit Global Positioning System (GPS) signals. The signals bounce up to satellites and record the latitude and longitude of the buoy position. Researchers travel to large icebergs via helicopter and dig into the firn, a layer of partially-compacted snow about a year old. Newer snow might blow away, and older snow is already compacted into ice, but the large granular firn can securely hold a GPS buoy until the iceberg breaks up.
It doesn’t end there. If you want to keep track of a remote floating chunk of ice, why not follow it from space? National Aeronautics and Space Administration (NASA) Satellites survey the icebergs’ movements through multiple means. When a visual image is preferred, scientists employ the Moderate Resolution Imaging Spectroradiometer (MODIS) sensors aboard NASA’s Terra and Aqua satellites. MODIS can create detailed images of surfaces on Earth by recording slight variations in reflected light. NASA’s QuikScat mission uses a radar scatterometer that transmits high-frequency radar pulses at Earth’s surface, then measures the pulses that bounce back into space. It can read ripples on the oceans surface caused by winds, or by the passage of icebergs larger than 12 by 12 miles [20 by 20 kilometers].
There’s more to icebergs than just ice
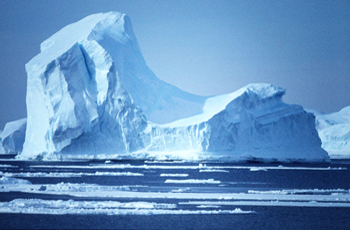
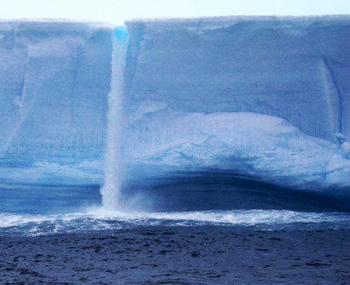
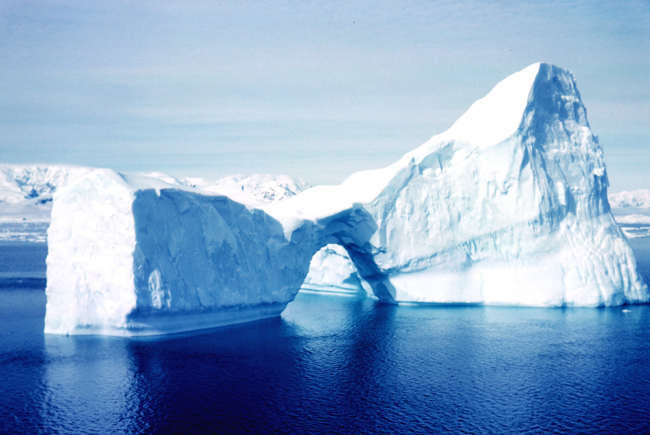
An iceberg’s life cycle can teach us a lot. Glacial ice, composed of many many years of accumulated snowfall, can literally show us history. At the edge of a tabular iceberg you can glimpse the layers of fresher snowfall, grainy firn, highly-compacted glacial ice, and layers in-between where snow atop the iceberg melted and refroze. The accumulated and compressed layers of glaciers and ice sheets tell a story about the past. The remains of wind-carried dust, pollen, and ash from volcanic eruptions are hidden in the ice, along with bubbles of air containing atmospheric gasses from years long past. Scientists drill long cylindrical ice cores and study their layers to discover Earth’s climate past.
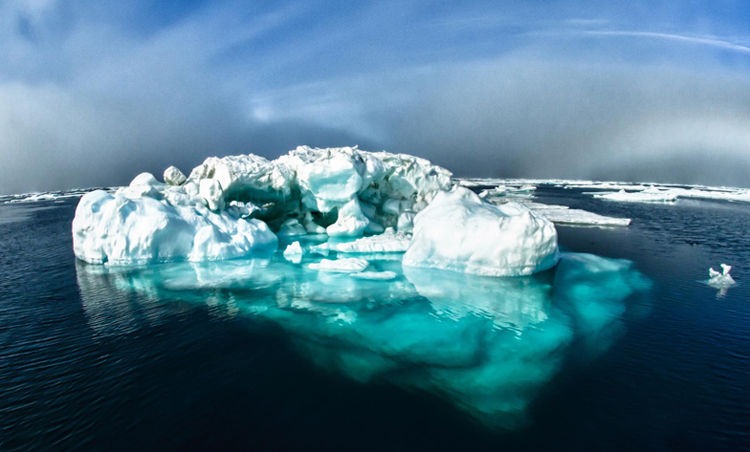
Iceberg layers sometimes appear blue. Normal ‘white’ light is made up of every color in the rainbow. When it travels through the ice, the chemically bonded oxygen and hydrogen in the frozen water tends to absorb the warmer colors, especially red. Thus the waves of light that pass through prominently are from the cooler end of the spectrum, which is why the ice can appear a beautiful blue.
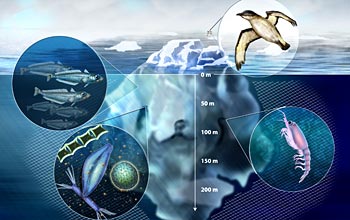
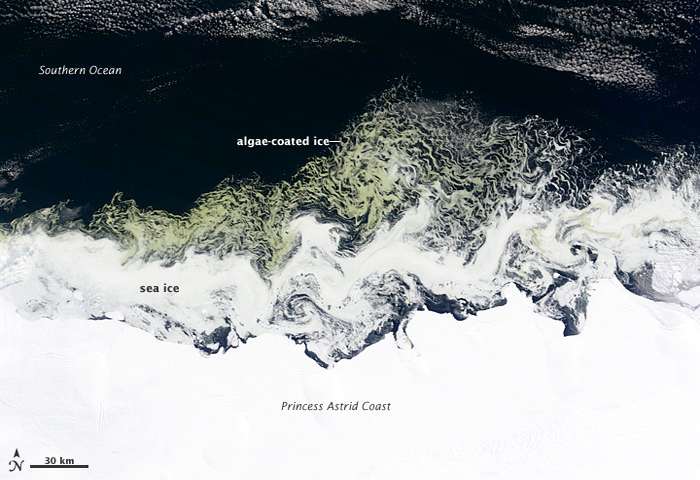
That might not be the only color you spot: ice can carry dirt or rocks, and often contains iron-rich sediment. Iron- and nutrient-rich meltwater that seeps off of icebergs into ocean water can fertilize microscopic phytoplankton (tiny plant-like organisms). Algae is a common type of phytoplankton. In sufficient quantities, the microscopic algae shows a visible green.
Phytoplankton including algae is part of the marine ecosystem. Zooplankton and krill feed on the phytoplankton, and are fed on in turn by fish, birds, whales, and other wildlife. Algae is also an important part of the global carbon cycle. Like plants, algae uses photosynthesis to produce energy. That means it takes up carbon dioxide from the atmosphere. When the algae dies it drifts slowly to the ocean floor and stays there for a long time. Algae impacts climate by acting as a carbon sink. It removes carbon dioxide from the atmosphere.
Icebergs are little models for big events
Icebergs are basically small puzzle pieces from larger ice sheets that are sometimes conveniently transported to warmer climes. In warmer temperatures, icebergs rapidly break-up or disintegrate. The accelerated break-up of a misplaced iceberg resembles what will eventually happen to floating ice sheets at the edge of Antarctica as global climate change inflicts heightened temperatures and melt rates in the coming centuries. Scientists investigate the processes that govern the death throes of icebergs in order to gain a better understanding of how ice sheets will react to the shifting temperatures of Earth’s climate future.
The more data on ice break-up the better, because data gathered in these studies will refine ice and climate models. Those models, run on powerful supercomputers, are a window into the future. The more robust and accurate the information put into the model, the better we can forecast how ice sheets will behave: respond to temperature changes, alter ocean circulation with an influx of meltwater, and contribute to sea level rise. Better projections will help us anticipate and adapt to climate change, and hopefully spur policy makers to take more steps toward mitigating negative human impact on our atmosphere and environment.
Radical disintegration has already come
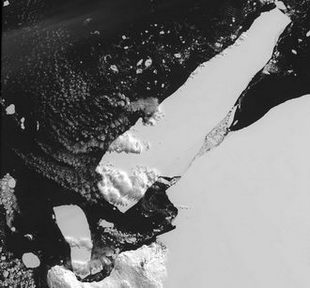
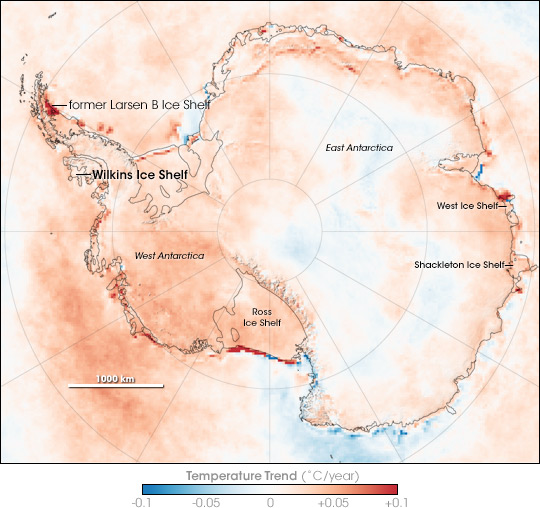
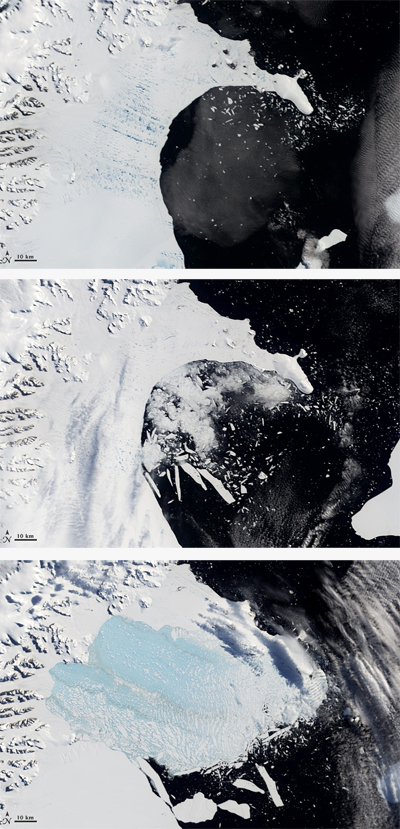
In recent history -up until two decades ago- humans observed periodic calving of icebergs from Antarctica’s great ice sheets. Periodic calving was believed to be the norm. Yet Antarctica’s ice is undergoing a dramatic change. In the last twenty years heightened temperatures and melt rates pushed several ice shelf edges back toward the borders of the southern continent. And then, in March of 2002, the Larsen B Ice Shelf disintegrated. The ice sheet was no longer undergoing a slow calving of icebergs; instead, it splintered and shattered. Larsen B was no lightweight- averaging 720 feet thick [220 meters thick], the ice shelf touched shore and extended into the Weddell Sea. The extent and speed of its breakup was unprecedented, never before recorded. In less than two months the ice shelf lost a surface area larger than that of Rhode Island. From January 31 to March 7, 2002, 1,250 square miles [3,250 square kilometers] of thick ice disintegrated into small pieces and drifted out to sea.
Larsen B is not alone. Other ice sheets, including more of the Larsen shelf and parts of the Weddell shelf, have been disintegrating. The dramatic break-ups are startling, and we’re struggling to understand what’s causing them.
One clear culprit is a warming ocean. Ocean water eats away at the underside of the ice shelves. This basal melting accounts for a high percentage of Antarctic ice sheet loss. One study led by Eric Rignot of NASA’s Jet Propulsion Laboratory and the University of California Irvine pointed the finger at basal melting for 55 percent of all Antarctic ice shelf mass loss from 2003 to 2008. When warm ocean water touches the sides of icebergs it also eats away at their structural integrity, carving deep sideways trenches which originate at the waterline.
Water on the surface of icebergs and ice sheets can be a major mechanism in the ice’s disintegration. Warm summer temperatures melt water on the ice’s surface. Normally, a small amount of melt water gathers over the summer and then refreezes in the winter, but of late unseasonably warm summers have been causing lots of melt water and surface ponds atop the ice. Water infiltrates small cracks in the ice, lubricates ice crystals, and harms the iceberg or ice sheet’s structural integrity. Water is denser than ice. It forces its way lower into crevices and causes a buildup of pressure inside the ice, fracturing the crevices further, weakening the whole.
The motion of the ocean itself is a factor in break-up. A team led by Douglas R. MacAyeal, Department of Geophysical Sciences, University of Chicago planted seismic sensors on Iceberg B15A. B15A was a 63 by 19 mile [100 by 30 km] fragment of colossus B15. On October 27, 2005, B15A broke into pieces. When the research team investigated the readings from their seismometers (machines that measure motion), they found that an oceanic swell arrived at B15A just prior to its break-up. Tracing that swell backwards via Pacific wave-buoys and seismometer stations near small Pacific islands, they discovered that the wave originated in Alaska. “Our jaws dropped,” stated MacAyeal. “We looked in the Pacific Ocean and there, 13,500 kilometers away, six days earlier, was the winter season’s first really big, nasty storm that developed and lasted for about a day and a half in the Gulf of Alaska.” The Alaskan storm generated the swell which traveled slowly to the other hemisphere and prompted B15A to break apart. The significant distance between the two events demonstrates that weather systems worldwide are capable of impacting the Antarctic ice sheet.
The balance that maintains ice sheets is delicate. As their surroundings warm, the properties and stability of the ice changes. And it’s all interconnected. Changes in atmospheric and oceanic circulation can have impacts that are hard to predict.
The sea level hangs in the balance
In themselves, melting icebergs and ice sheets do not raise the sea level; they are already floating in water, displacing their own mass. They do influence sea level in that they normally help control and slow glacial flow. The glaciers resting on the Antarctic continent and on Greenland push more ice (and thus more fresh water) into the ocean as they continually slide toward the sea. When ice sheets disintegrate they no longer stand in the glaciers’ path, putting the ‘brakes’ on their glaciers’ motion. Glaciers accelerate, which causes sea levels to rise. NASA Earth Observatory’s World of Change article on the disintegration of the Larsen ice shelf notes: “Following the even more spectacular collapse in 2002, the Larsen A and B glaciers experienced an abrupt acceleration, about 300% on average, and their mass loss went from 2–4 gigatonnes per year in 1996 and 2000 (a gigatonne is one billion metric tonnes), to between 22 and 40 gigatonnes per year in 2006.” Glaciers moving 300 percent faster means more water that was once frozen in the ice cap atop solid ground will enter ocean waters.
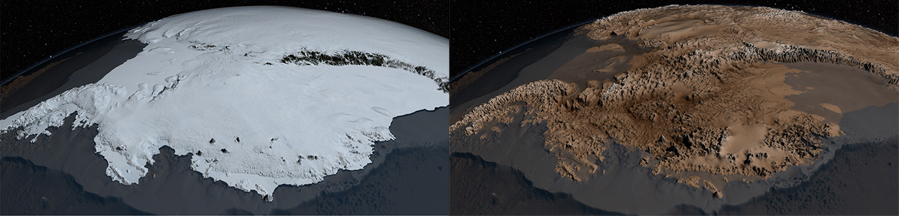
Ice loss in West Antarctica and Greenland is accelerating. And the ice sheets are losing ice faster than they gain new ice from snowfall accumulating and compacting atop them. According to the National Snow and Ice Data Center, the Antarctic ice sheet contains 7.2 million cubic miles [30 million cubic kilometers] of ice. It extends nearly 5.4 million square miles [14 million square kilometers]. In contrast, Greenland’s ice sheet covers only about 650,000 square miles [1.7 million square kilometers], yet if Greenland’s ice alone melted entirely the global sea level would rise 23 feet [7 meters]. If the ice sheets of both Greenland and Antarctica melted entirely, global sea level would rise by just about 230 feet [70 meters]. Thankfully that’s unlikely to happen anytime soon. A study funded by the National Science Foundation estimates that by 2100, global sea level will rise by as much as 3 to 6 feet [about 1 to 2 meters].
That’s in the short term. Another National Science Foundation funded study examined the late Pliocene epoch (2.7 million to 3.2 million years ago) when Earth’s atmosphere held modern-day levels of carbon dioxide and temperatures were 3.6 degrees Fahrenheit [2 degrees Celsius] higher than they are now. Sea levels then were as much as 70 feet [21 meters] higher than they are currently. Limiting future global warming to 3.6 degrees Fahrenheit is the suggestion of the Intergovernmental Panel on Climate Change, and not necessarily a goal that humankind will attain without solid steps to mitigate anthropogenic (human-created) causes of global climate warming.
David Vaughan, glaciologist at the British Antarctic Survey, notes that “Climate seems to have been relatively stable on the Antarctic Peninsula for the past 1,800 years, but then 50 or 100 years ago, it began to change.” National Snow and Ice Data Center records show that over the past 50 years, Antarctic regional air temperature increased 4.5 degrees Fahrenheit [2.5 degrees Celsius], a number that is five times the rate of warming measured for the rest of the world.
That’s big news. Chilling, even, considering the complex interactions of the atmosphere, ocean, and cryosphere. The Antarctic is a region with the potential to respond very quickly to climate changes… even relatively small events happening in another hemisphere. The occurrence of climate anomalies impacting each other at distances of thousands of miles, like the Alaskan storm breaking apart the Antarctic iceberg, is called teleconnection, and the implications of teleconnection become stronger with the recognition that climate change is promoting more extreme weather events. Ice sheet melt can free up glaciers to more swiftly discharge ice into the ocean, raising the sea level and threatening coastal communities across the globe. Because their potential impact is so large, scientists are especially eager to understand the forces that drive glacial melt. Every step taken toward understanding the causes and effects of iceberg and ice sheet break-up are at heart an effort to improve our simulations and understanding of our climate future.
.
Frontier Scientists: presenting scientific discovery in the Arctic and beyond
References:
- ‘Billionaire unveils new ‘Titanic II’ cruise ship design’ USA Today (2013) http://www.usatoday.com/story/travel/cruises/2013/02/26/titanic-ii-will-be-built/1948935/
- ‘About International Ice Patrol (IIP)’ U.S. Coast Guard Navigation Center (2012) http://www.navcen.uscg.gov/?pageName=IIPHome
- ‘Ice Trek: Exploring the Lifecycle of a Drifting Antarctic Iceberg’ National Snow & Ice Data Center (2008) http://www.nsidc.org/icetrek/index.html
- ‘Antarctic icebergs help the ocean take up carbon dioxide’ Kim Fulton-Bennett, Monterey Bay Aquarium Research Institute (2011) www.mbari.org/news/news_releases/2011/icebergs/icebergs-dsr-release.html
- ‘Collapse of the Larsen-B Ice Shelf’ NASA Earth Observatory : World of Change (2002) http://www.earthobservatory.nasa.gov/Features/WorldOfChange/larsenb.php
- ‘Disintegration: Antarctic Warming Claims Another Ice Shelf’ Michon Scott, National Aeronautics and Space Administration : Earth Observatory (2008) http://www.earthobservatory.nasa.gov/Features/WilkinsIceSheet/
- ‘Warm Ocean, Not Icebergs, Causing Most of Antarctic Ice Shelves’ Mass Loss’ Whitney Clavin, National Aeronautics and Space Administration : News Releases (2013) http://www.nasa.gov/home/hqnews/2013/jun/HQ_13-183_Melting_Ice_Shelves.html
- ‘Transoceanic wave propagation links iceberg calving margins of Antarctica with storms in tropics and Northern Hemisphere’ Douglas MacAyeal, et al., American Geophysical Union : Geophysical Research Letters (2006) http://onlinelibrary.wiley.com/doi/10.1029/2006GL027235/full
- ‘Evidence Linking Arctic Amplification to Extreme Weather in Mid-Latitudes’ Jennifer A. Francis and Steve J. Vavrus, American Geophysical Union : Geophysical Research Letters (2012) http://www.agu.org/pubs/crossref/pip/2012GL051000.shtml
- ‘Glacier Movement Limits How Fast Sea Level Can Rise’ Diane Banegas, National Science Foundation (2008) http://www.nsf.gov/discoveries/disc_summ.jsp?cntn_id=112253
- ‘Global Sea Level Likely to Rise as Much as 70 Feet in Future Generations’ Cheryl Dybas, National Science Foundation (2012) http://www.nsf.gov/news/news_summ.jsp?org=NSF&cntn_id=123545